A common question I am asked is “How will scrum deliver my projects on time?” and the honest answer is: it may not. Scrum is not a cure-all that can somehow force 10lbs of crap into a 5lbs bag. If a project contains too much scope and not enough time to do everything nothing can change that (especially not by adding more people to the mix).
That said, the power of scrum comes from its ability to make visible the data necessary to develop a fairly accurate completion window. This is accomplished by tracking a team’s velocity sprint-over-sprint and extrapolating a trendline from these data.
What is velocity and how do I get some?
On its face, velocity is a pretty simple concept. It is the sum of the story points attached to the work a team completes in a set amount of time (a sprint). However, there are myriad mitigating circumstances that can undercut its value:
- A lack of stable teams. If a team’s roster is constantly in flux, velocity becomes a much more dubious measure. What’s more, it’s not mitigated by ensuring swaps maintain a stable headcount. Different personalities and primary skill-sets can shift how teams function. Doing work with 3 people you jibe with could offer better results than work done with your 3 mortal enemies.
- A team member takes a vacation or sick day. Naturally, teams will see a dip in velocity with fewer people actively working during a sprint.
- A sprint includes a work holiday. A team will likely get less done during a sprint that includes Christmas Day than one that does not.
- The team is still learning how to estimate with story points. One of scrum’s benefits is it’s refusal of expressing effort in hours. Rather than touting the placebo of hour
estimates guesses, work segments in scrum are given story points—an abstracted measurement based on the amount of effort, complexity, and risk associated with finishing the task. When teams first start using this method, they may see a fluctuation of estimates as they settle on how to apply story points consistently.
- A lack of T-shaped team members. Being T-shaped means having a primary skill-set (the vertical stem of a capital T) while still being able to do most other things at a less-than-advanced level (the horizontal bar of a capital T). If a sprint’s ticket makeup favors a specific skill-set, completed stories may suffer as a result. While ideally any scrum team will be 100% cross-functional, reality does not always meet such pleasant criteria.
Setting these concerns aside, over time, velocity’s power grows in relation to the size of the dataset. The more sprints a stable team has under their collective belts, the more accurate completion timeframes become in project forecasts.
Prognostication through burnup charts
While burndown charts may be kings of individual sprints, for tracking a whole project, I prefer to use their soothsaying cousin: the burnup chart. A burnup chart shows both work completed and how much work is left until a project is done.
To plot a worthwhile burnup chart, two data points are needed, each carrying their own caveats:
- a project/product backlog with story points added to every item (caveat: keep in mind that burnups can handle an inflight scope change)
- a target completion date (caveat: the completion timeframe will shift forwards or backwards each sprint as more or less work is accomplished by the team—the good news being this timeframe will become much more certain with each completed sprint)
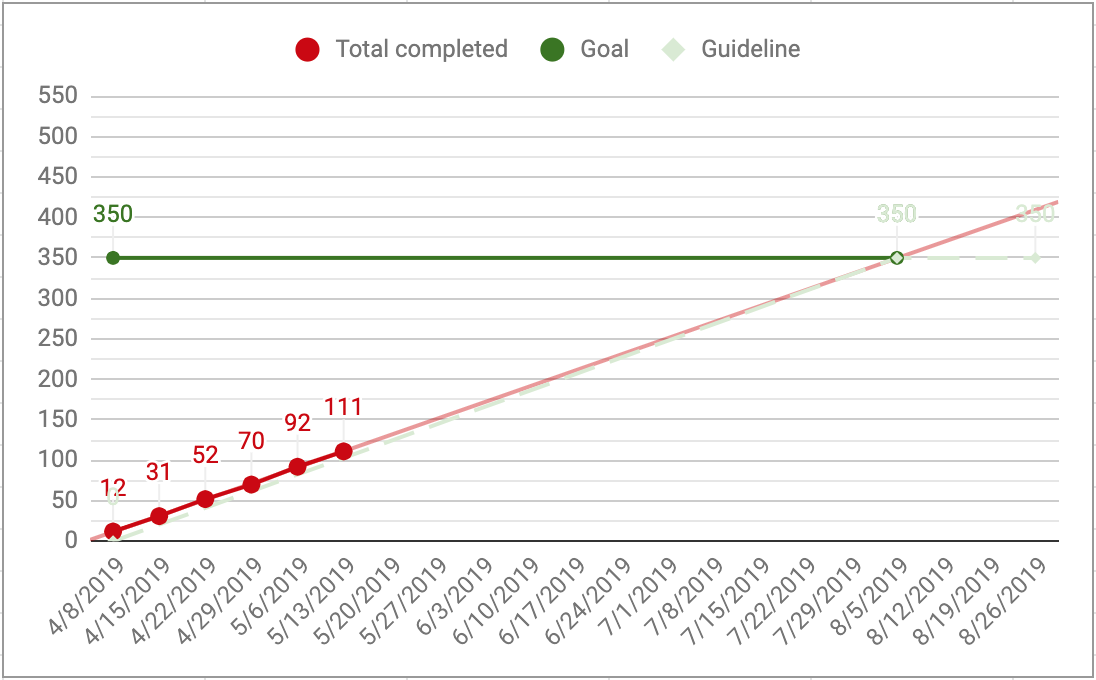
This template is based on what I use to track active projects. In it, I have plotted an example project with code ZYX. The datatab has all the information I need to begin forecasting: the project’s name, its start date, the sprint length expressed in calendar days (I work in one-week sprints, so have entered 7), and a starting story point total.
Tab ZYX is where the magic happens. At the end of each sprint, I enter the amount of story points completed in Column C, letting the sheet do the rest of the work for me. A trendline is automatically plotted based on these data. This tab also feeds data back into the datatab view, calculating the amount of story points left in the project. As you can see, the team is right on track to finish the whole ZYX project the first week of August.
The other tabs show how a burnup handles more true-to-life situations: ZYX (slow) for a team that is dealing with low velocity, ZYX (early) for a team that is increasing their velocity through efficiency gains, and ZYX (scope change), which shows how a burnup can accommodate an agreed upon scope increase—here showing that 50 more story points were added at the beginning of July.
I have also tweaked this visualization method to track monthly maintenance project progress as well.
In the end, scrum isn’t about knowing exactly when something will happen. Rather, it offers a highly reliable sense of when work will very likely be completed. With this information, teams can make adjustments early on to increase output, rather than suffer burnout and all-nighters at the tail end of a project when that “oh shit” moment rears it’s stinky head. And what’s more, project stakeholders can have confidence in project progress rather than hoping the rabbit-out-of-the-hat forecasts of project planning will come true in the end.